13.11. Bootstrap Confidence Intervals#
Futher Reading: §5.10 and §6.15 in Navidi (2015)
13.11.1. Learning Objectives#
After studying this notebook, attending class, asking questions, and reviewing your notes, you should be able to:
Calculate z, t, and bootstrap confidence intervals.
Compare the three confidence intervals.
# load libraries
import scipy.stats as stats
import numpy as np
import scipy.optimize as optimize
import math
import matplotlib.pyplot as plt
13.11.2. Motivating Example: Catalyst Lifetime#
This motivating example and confidence intervals are further explored in this previous notebook.
# declare data in a list
lifetime = [3.2, 6.8, 4.2, 9.2, 11.2, 3.7, 2.9, 12.6, 6.4, 7.5, 8.6,
            4.5, 3.0, 9.6, 1.5, 4.5, 6.3, 7.2, 8.5, 4.2, 6.3, 3.2, 5.0, 4.9, 6.6]

# number of observations
n = len(lifetime)

# calculate sample mean and standard deviation
xbar = np.mean(lifetime)
s = np.std(lifetime)

# two ways to round
print("Lifetime Average:",round(xbar,2)," hours")
print("Lifetime Standard Deviation: {:.2f} hours".format(s))

# calculate zstar
zstar95 = stats.norm.interval(0.95)
print("\nz-star for two-sided 95% interval:",zstar95)
Lifetime Average: 6.06  hours
Lifetime Standard Deviation: 2.72 hours

z-star for two-sided 95% interval: (-1.959963984540054, 1.959963984540054)
13.11.3. z Confidence Interval#
where the sample standard deviation \(s\) is used to approximate the population standard deviation \(\sigma\).
# z-interval
# calculate zstar
zstar95 = np.array(stats.norm.interval(0.95))
print("\nz-star for two-sided 95% interval:",zstar95)

# calculate confidence interval
print("95% z confidence interval: ",xbar + (s/np.sqrt(n))*zstar95," hours")
z-star for two-sided 95% interval: [-1.95996398  1.95996398]
95% z confidence interval:  [4.99836313 7.12963687]  hours
13.11.4. Student’s t Confidence Interval#
# t-interval
# calculate tstar
tstar95 = np.array(stats.t.interval(0.95,n-1))
print("\nt-star for two-sided 95% interval:",tstar95)

# calculate confidence interval
print("95% t confidence interval: ",xbar + (s/np.sqrt(n))*tstar95," hours")
t-star for two-sided 95% interval: [-2.06389856  2.06389856]
95% t confidence interval:  [4.94185366 7.18614634]  hours
13.11.5. Basic Bootstrap with Replacement#
Main Idea
Specify sample size \(n\) and number of times to simulate \(m\)
For each of \(m\) simulations:
Choose \(n\) items, with replacement, from the sample
Calculate the mean (or another statistic)
Create a histogram
Compute percentiles and construct confidence interval
n_samp = len(lifetime)
m_sim = 1000
xbar_boot = np.zeros(m_sim)
for i in range(m_sim):
# sample with replacement
sample = np.random.choice(lifetime, size=n_samp, replace=True)
# calculate bootstrap sample mean
xbar_boot[i] = np.mean(sample)
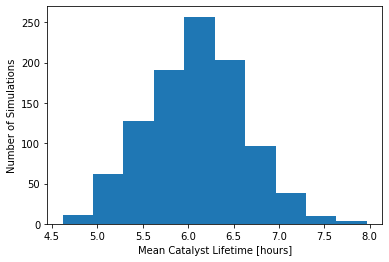
# plot histogram
plt.hist(xbar_boot)
plt.xlabel("Mean Catalyst Lifetime [hours]")
plt.ylabel("Number of Simulations")
plt.show()
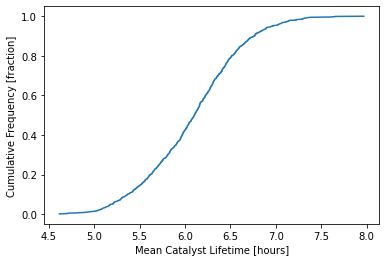
We can also create an empirical cumulative distribution of the bootstrap sample mean.
plt.plot(np.sort(xbar_boot),np.linspace(1/m_sim,1.0,m_sim))
plt.xlabel("Mean Catalyst Lifetime [hours]")
plt.ylabel("Cumulative Frequency [fraction]")
plt.show()
To calculate a two-sided 95% confidence interval, we just need to look up the 2.5% and 97.5% of the boot sample means:
ci_low = np.percentile(xbar_boot,2.5)
ci_high = np.percentile(xbar_boot,97.5)

# calculate confidence interval
print("95% bootstrap confidence interval: [",ci_low,", ",ci_high,"] hours")
95% bootstrap confidence interval: [ 5.0839 , 7.1322 ] hours
13.11.6. Final Thoughts#
Comparison of z, t, and bootstrap confidence intervals:
Z intervals are typically used when the sample size n>30 and you know the population standard deviation.
T intervals are used for a sample size n<30 and when the population standard deviation is unknown.
Bootstrap confidence intervals are especially used when we want to know about statistics other than the mean or when there are multiple parameters for the function. Bootstrap is also helpful for situations where the data might not be normal as this method will provide more accurate results in that case than the other confidence intervals.