12.1. Measurement Error#
Further Reading: §3.1 in Navidi (2015)
12.1.1. Learning Objectives#
After studying this notebook, completing the activities, engaging in class, and reading the book, you should be able to:
Define terms related to the measurement of uncertainty
Distinguish between accuracy and precision
import numpy as np
import matplotlib.pyplot as plt
All measurements have uncertainty. As engineers, we need to i) gather data, ii) estimate uncertainty, iii) propagate uncertainty through calculations, and, ultimately iv) draw conclusions and make decisions under uncertainty.
Let’s get started with some important definitions.
Home Activity
Read pg. 164 - 165 in Navidi (2015). Fill in the following definitions.
12.1.2. Definitions#
Error:
Systematic Error / Bias:
Random Error:
Accuracy:
Unbiased:
Precision:
Random / Statistical Uncertainty:
12.1.3. Accuracy vs. Precision#
Target practice is a classic example used to explain how accuracy and precision are different:
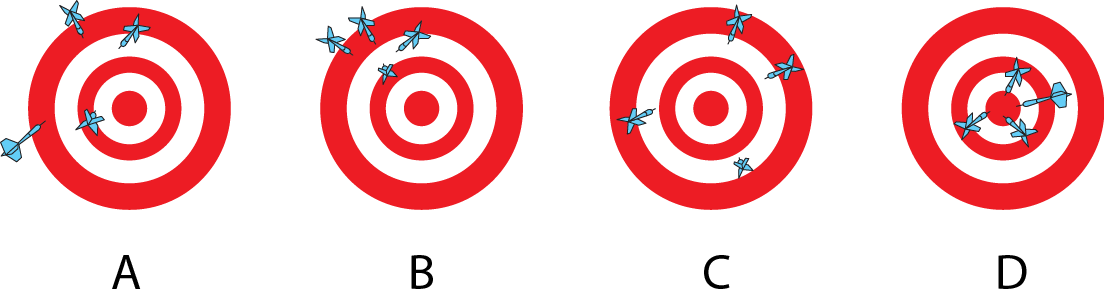
Home Activity
Write captions for each figure. Using target practice as an example, explain how accuracy and precision are different.
Home Activity Answers:
(Write captions for each figure.)
A:
B:
C:
D:
(In 1 sentence, explain how accuracy and precision are different.)
Explanation:
Home Activity
Answer the following multiple choice question. Store your answer in the integer variable ans_16a_1.
12.1.4. Practice Problem 1#
The boiling point of water at sea level is measures four times. The results are 110.01 °C, 110.02 °C, 109.99 °C, and 110.01 °C. Which is the following statements best describes the measuring process:
Accurate but not precise
Precise but not accurate
Neither accuracy nor precise
Both accurate and precise
# Add your solution here
# Removed autograder test. You may delete this cell.
Armed with those definitions, we can beginning to connect experimental measurements with probability theory. Here are some key ideas:
A measured value is a random variable with mean \(\mu\) and standard deviation \(\sigma\).
The bias in the measuring process is the difference between the mean measurement and the true value: Bias = \(\mu\) - true value
The uncertainty in the measuring process is the standard deviation \(\sigma\).
The smaller the bias, the more accurate the measuring process.
The smaller the uncertainty, the more precise the measuring process.
A key idea in statistical analysis is to use a sample, e.g., data gathered from repeat experiments, to estimate the population mean and variance. For example, imagine we wanted to know the weight of a brick. From repeated measurements on a scale, we could compute a sample mean and standard deviation. This is an estimate to the population true weight of the brick (population mean) random noise from the scale (population standard deviation).
Let \(X_1\), \(X_2\), …, \(X_n\), be independent measurements, all made by the same process on the same quantity.
The sample standard deviation \(s\) can be used to estimate the uncertainty.
Estimates of uncertainty are often crude, especially when based on sample samples.
If the true value is know, the sample mean \(\bar{X}\) can be used to estimate the bias: Bias \(\approx\) \(\bar{X}\) - true value
If the true value is unknown, the bias cannot be estimated from repeat measurements.
12.1.5. Practice Problem 2#
Home Activity
Answer the following true false questions. Store your answer in the dictionary ans_16a_2. Use the integers 1, 2, 3, and 4 as the keys. Record strings ‘F’ or ‘T’ as the values.
The weight of an object is given as 67.2 \(\pm\) 0.3g. True of false:
The weight was measured to be 67.2 g.
The true weight of the object is 67.2 g.
The bias in the measurement is 0.3 g.
The uncertainty in the measurement is 0.3 g.
# Create dictionary to store the answers
ans_16a_2 = {}

# Add your solution here
# Removed autograder test. You may delete this cell.