12.5. Simulation#
Further Reading: §4.12 in Navidi
12.5.1. Learning Objectives#
After studying this notebook, completing the activities, engaging in class, and reading the book, you should be able to:
Estimate probabilities using simulation
Use a simulation to identify normal distribution
Affirm error propagation skills using a simulation
import numpy as np
import matplotlib.pyplot as plt
12.5.2. Motivating Example#
Consider two resistors in parallel with resistances \(X \sim \mathcal{N}(10~\Omega,~10^2~\Omega^2)\) and \(Y \sim \mathcal{N}(25~\Omega,~2.5^2~\Omega^2)\). The total resistance of the circuit is
Assume \(X\) and \(Y\) are independent.
Notation: \(X \sim \mathcal{N}(10~\Omega,~10^2~\Omega^2)\) says that random variable \(X\) is normally distributed with mean \(10~\Omega\) and variance \(10^2~\Omega^2\). Next class we will learn more about the normal distribution. But you can solve this problem using only the mean and variance.
What is \(P(19~\Omega \leq R \leq 21~\Omega)\), i.e., the probability the circuit is within specification?
Home Activity
Pause the video. Spend 3 minutes outlining your solution strategy using probability theory. First, write down the main steps. Then, if you have time, write down the formulas.
Home Activity
Now watch the video. Does your approach match the class discussion? We will study the normal distribution more next class session.
12.5.3. Using Simulation to Estimate a Probability#
Intead of all of that calculus, we can use simulation to estimate this probability.
Repeat 1000s of times:
Generate X and Y using a random number generator
Compute \(R\) and record the value
# specify number of simulations
nsim = 1000

# create vector to store the results
R_sim = np.zeros(nsim)


# create normally distributed noise
# loc = mean
# scale = standard deviation
x = np.random.normal(loc = 100, scale = 10, size=(nsim))
y = np.random.normal(loc = 25, scale=2.5, size=(nsim))

# calculate a1, store result
R_sim = x * y / (x + y)
Home Activity
Estimate \(P(19~\Omega \leq X \leq 21~\Omega)\) using your simulation results.
12.5.4. Using Simulation to Estimate Means and Variances#
# print some descriptive statistis
print("Mean: ",np.mean(R_sim)," Ohms")
print("Median: ",np.median(R_sim)," Ohms")
print("Standard Deviation: ",np.std(R_sim,ddof=1)," Ohms")
Mean:  19.86428600916683  Ohms
Median:  19.8880493824031  Ohms
Standard Deviation:  1.7022703484623463  Ohms
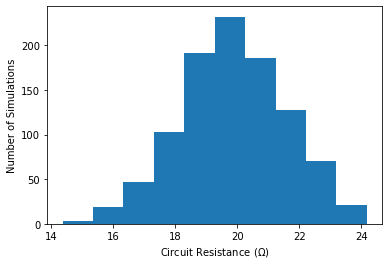
12.5.5. Using Simulation to Determine Whether a Population is Approximately Normal#
# create histogram of calculated a1 values
plt.hist(R_sim)
plt.xlabel("Circuit Resistance ($\Omega$)")
plt.ylabel("Number of Simulations")
plt.show()