11.3. Poisson Probability Distributions#
Further Reading: §4.3 in Navidi (2015)
11.3.1. Learning Objectives#
After studying this notebook, completing the activities, engaging in class, and reading the book, you should be able to:
Model scientific and engineering problems using the Poisson distribution.
import numpy as np
import math
import matplotlib.pyplot as plt
11.3.2. Definition#
The Poisson distribution is important for modeling rare events including failures and radioactive decay.
If \(X \sim\) Poisson(\(\lambda\)), then:
\(X\) is a discrete random variable whose possible values are the non-negative integers (\(x\) is unbounded)
The parameter \(\lambda\) is a positive constant
The probability mass function is
The Poisson probability mass function is very close to the binomial probability mass function when \(n\) is large, \(p\) is small, and \(\lambda = n p\).
The mean is \(\mu_X = \lambda\)
The variance is \(\sigma_X^2 = \lambda\).
Alright, those are nice properties, but how do you specify \(\lambda\)? Often the Poisson distribution is used to model the number of rare events during a fixed duration. In this context, \(\lambda\) is the expected number of rare events. Let’s look at an example.
11.3.3. Example: Failure Rates#
Consider a flood occurs on a specific river once every 100 years. Calculate the probability 0, 1, 2, …, 6 floods occur in the next 100 years. Assume the Poisson distribution accurately models flooding on this river.
Step 0: Identify \(\lambda\)
We are modeling floods, which are a rare event. The fixed duration is 100 years. We expect 1 flood every 100 years, so \(\lambda = 1\).
Step 1: Write a function to evaluate the PDF
def poisson(k,lmb):
    ''' PMF for Poisson distribution
    Args:
        k: number of events
        lmb: average number of events per interval
    Return:
        probability of k events occuring during interval
    '''

    assert k >= 0
    assert lmb >= 0

    return np.exp(-lmb) * lmb**k / math.factorial(k)
Step 2: Test out function for 10 floods
poisson(10,1)
1.0137771196302975e-07
Step 3: Answer the question asked
Home Activity
Evaluate the probabilities of 0 to 6 floods during the next 100 years. Store your answer as a numpy array p_floods such that p_floods[3] is the probability of 3 floods.
n_floods = range(0,7)
p_floods = np.zeros(7)

# Add your solution here
# Removed autograder test. You may delete this cell.
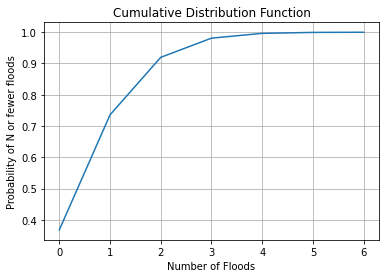
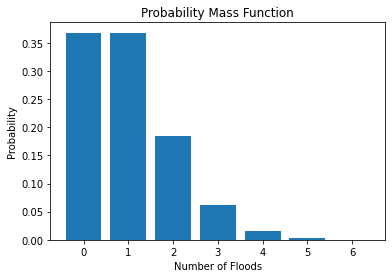
Using our results, we can plot the probability mass function and cumulative density function:
plt.bar(n_floods,p_floods)
plt.xlabel("Number of Floods")
plt.ylabel("Probability")
plt.title("Probability Mass Function")
plt.show()
# calculate cumulative sum
cum_p_floods = np.cumsum(p_floods)

# Create the plot
plt.plot(n_floods,cum_p_floods)
plt.xlabel("Number of Floods")
plt.ylabel("Probability of N or fewer floods")
plt.grid(True)
plt.title("Cumulative Distribution Function")
plt.show()