Lab 2: Relay (On-Off) Control#
Your Name:
In this lab assignment you will implement relay control for the Temperature Control Laboratory. The class website explains the Python interface to the TCLab in more detail.
Implement and test a relay control for the heater/sensor system
Implement and test a relay control to track a complex setpoint.
Exercise 1. Simple Relay Control#
Create a relay controller subject to the following requirements:
Simultaneous control of sensor temperatures T\(_1\) and T\(_2\) to setpoints 35 and 40 °C, respectively. The setpoints return to 25 °C at t = 300.
Use a tolerance value \(d\) of 0.5 °C.
Set the minimum and maximum values of the heater to 0 and 100%, respectively. lab.P1 and lab.P2 should be left at their default values.
Show the results of an experiment in which the setpoints are adjusted accordingly.
Some started code is include below.
# As a first step, let's verify the sample code runs

from tclab import TCLab, clock, Historian, Plotter, setup

TCLab = setup(connected=True)

# modify these setpoints to change with time

def SP1(t):
    """Set point definition for T1
    Arguments:
        t: time (s)
    Returns:
        set point of T1
    """
    return 40

def SP2(t):
    """Set point definition for T2
    Arguments:
        t: time (s)
    Returns:
        set point of T2
    """
    return 35

# relay controller
def relay(SP, d=1, Umin=0, Umax=100):
    """Relay controller definition
    Arguments:
        SP: set point function
        d: set point tolerance
        Umin: minimum heater output (%)
        Umax: maximum heater output (%)
    Returns:
        none
    """
    #start with the heater off
    U = 0
    #while the simulation is active (t<tfinal)
    while True:
        t, T = yield U
        #When T is below the set point, turn on heater
        if T < SP(t) - d/2:
            U = Umax
        #When T is above the set point, turn off heater
        if T > SP(t) + d/2:
            U = Umin

# create a single control loop for T1
controller1 = relay(SP1)
controller1.send(None)

#simulate with TCLab
t_final = 60 # change this to 500 seconds for the actual experiment
t_step = 1
with TCLab() as lab:
    sources = [("T1", lambda: lab.T1), ("T2", lambda: lab.T2),
               ("SP1", lambda: SP1(t)), ("SP2", lambda: SP2(t)),
               ("Q1", lab.Q1), ("Q2", lab.Q2)]
    #load historian
    h = Historian(sources)
    #load plotter
    p = Plotter(h, t_final, layout=(("T1", "SP1"), ("T2", "SP2"), ("Q1", "Q2")))
    #While time is less than tfinal
    for t in clock(t_final, t_step):
        # This starter code only manipulates U1 to control T1.
        # Your specifications also give a setpoint for T2
        T1 = lab.T1
        #Send the controller time and T1 data
        U1 = controller1.send([t, T1])
        lab.Q1(U1)
        #Read data and update plot
        p.update()
# Verify your device has cooled back to ambient
tfinal = 30 #seconds

# perform experiment
with TCLab() as lab:
    #Set power to 0
    lab.U1 = 0
    lab.U2 = 0
    #load historian
    h = Historian(lab.sources)
    #Load plotter
    p = Plotter(h, tfinal)
    #While time is less than tfinal
    for t in clock(tfinal):
        #Read data and update plot
        p.update(t)
# Copy the code from above and modify to match the specifications

# Add your solution here
Exercise 2. Tempering Chocolate#
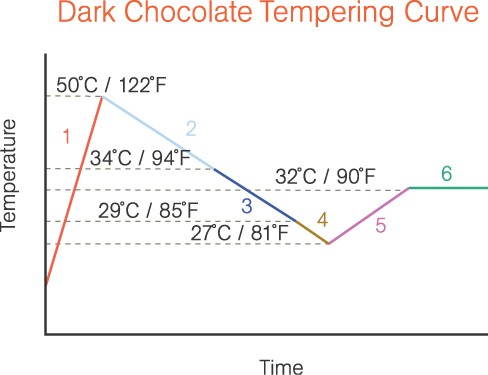
We now want to create a rely controller that matches the temperature profile for tempering chocolate.
Temperature 1 specifications:
Start from ambient.
Reach 50 °C at 3 minutes, 27 °C at 7 minutes, return to 32 °C at 8 minutes, and hold until 10 minutes.
The goal is follow the linear ramp between setpoints as closely as possible.
Temperature 2 specifications:
Start from ambient, ramp, and then hold at 30 °C.
Hints:
Modify SP1 to linearly interpolate the set point as a function of time.
# Copy your code from above and modify to match the specifications

# Add your solution here
Discussion#
Write a 1 to 3 sentences to answer each of the following questions.
Describe the shape of the temperature profiles (time-series) for the excrise 1 experiment. Are these shapes expected?
Answer:
Speculate about why T1 overshoots the setpoint more than T2 in the excerise 1 experiment.
Answer:
In the cholcate tempering simulation, how many times does each heater transitions from (a) one to off and (b) off to on? Fill in the table below.
Sensor |
On to Off |
Off to On |
|---|---|---|
T1 |
||
T2 |
Answer:
Descibe the shape of the T1 and T2 timeseries for the excerise 2 experiment. How do the T1 and T2 profiles relate to the on/off and off/on transitions for Q1 and Q2?
Answer:
How can we reduce the oscillations in these experiments? Propose at least one idea and provide reasoning for why it could work.
Answer:
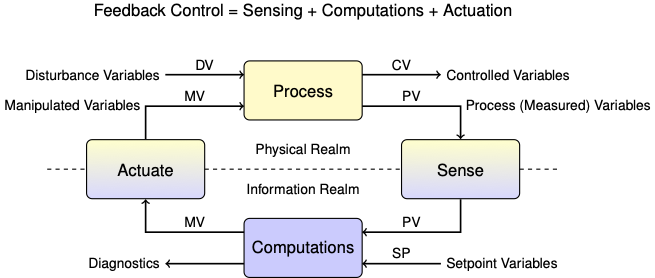
Consider the following feedback diagram from the first day of class:

Identify the variables in each of the categories for our temperature control lab.
Maninpulated Variable(s):
Answer:
Controlled Variable(s):
Answer:
Process/Measured Variable(s):
Answer:
Set Point Variable(s):
Answer:
Disturbance Variable(s):
Answer:
How can we reduce the oscillations in these experiments? Propose at least one idea and provide reasoning for why it could work.
Answer:
Common Mistakes#
Not using the correct kernel (for the controls environment with TCLab installed)
Not setting up controller #2 (This includes assigning T2 and Q2 in the simulation code)
When switching to connected=True most got errors if they did not restart the kernel and clear all the cells output
Trying to create their own linear interpolation function, need to use np.interp


